Calibration standards for XRF
X-ray fluorescence spectroscopy
The Only Correct Calibration Method – The Matrix Being Analyzed Must Also Be the One Used for Calibration
X-ray fluorescence (XRF) spectrometers are non-destructive analytical devices that can be handheld or desktop models used for chemical analysis. XRF can analyze elements from sodium to uranium in solids in a non-destructive and cost-effective manner.
Especially in the field of geosciences, handheld XRF analyzers have become indispensable due to their simplicity and practicality in field use. To ensure reliable analysis results, the device must be regularly calibrated. Environmental factors such as temperature are highly variable in the field, and the device must consistently deliver accurate analysis results. Regular drift correction is also necessary.
Logically, the device must be calibrated with a material similar to what it will measure – ideally, a solid, compact substance like our pressed pellets, rather than loose powder. Only this way can it be guaranteed that the device is perfectly calibrated under current environmental conditions and thus performs accurate measurements.
It is also possible to produce a customised reference material perfectly suited for your needs.

The measurement mode was the GeoChem setup, which employed a 3-beam fundamental parameter quantification. Beam number 1 was 40 kV for 120 seconds, Beam 2 was 10 kV or 60 s and beam 3 was 50 kV for 60 s. The respective elements measured on each beam are as follows:
Beam 1 (40 kV): Ti, V, Cr, Mn, Fe, Co, Ni, Cu, Zn, As, Se, Rb, Sr, Y, Zr, Nb, Mo, Ag, Cd, Sn, Sb, Ba, W, Hg, Pb, Bi, Th, U, LE
Beam 2 (10 kV): Mg, Al, Si, P, S, K, Ca, Ti, Mn
Beam 3 (50 kV): Ag, Cd, Sb, Ba, La, Ce, Pr, Nd, LE
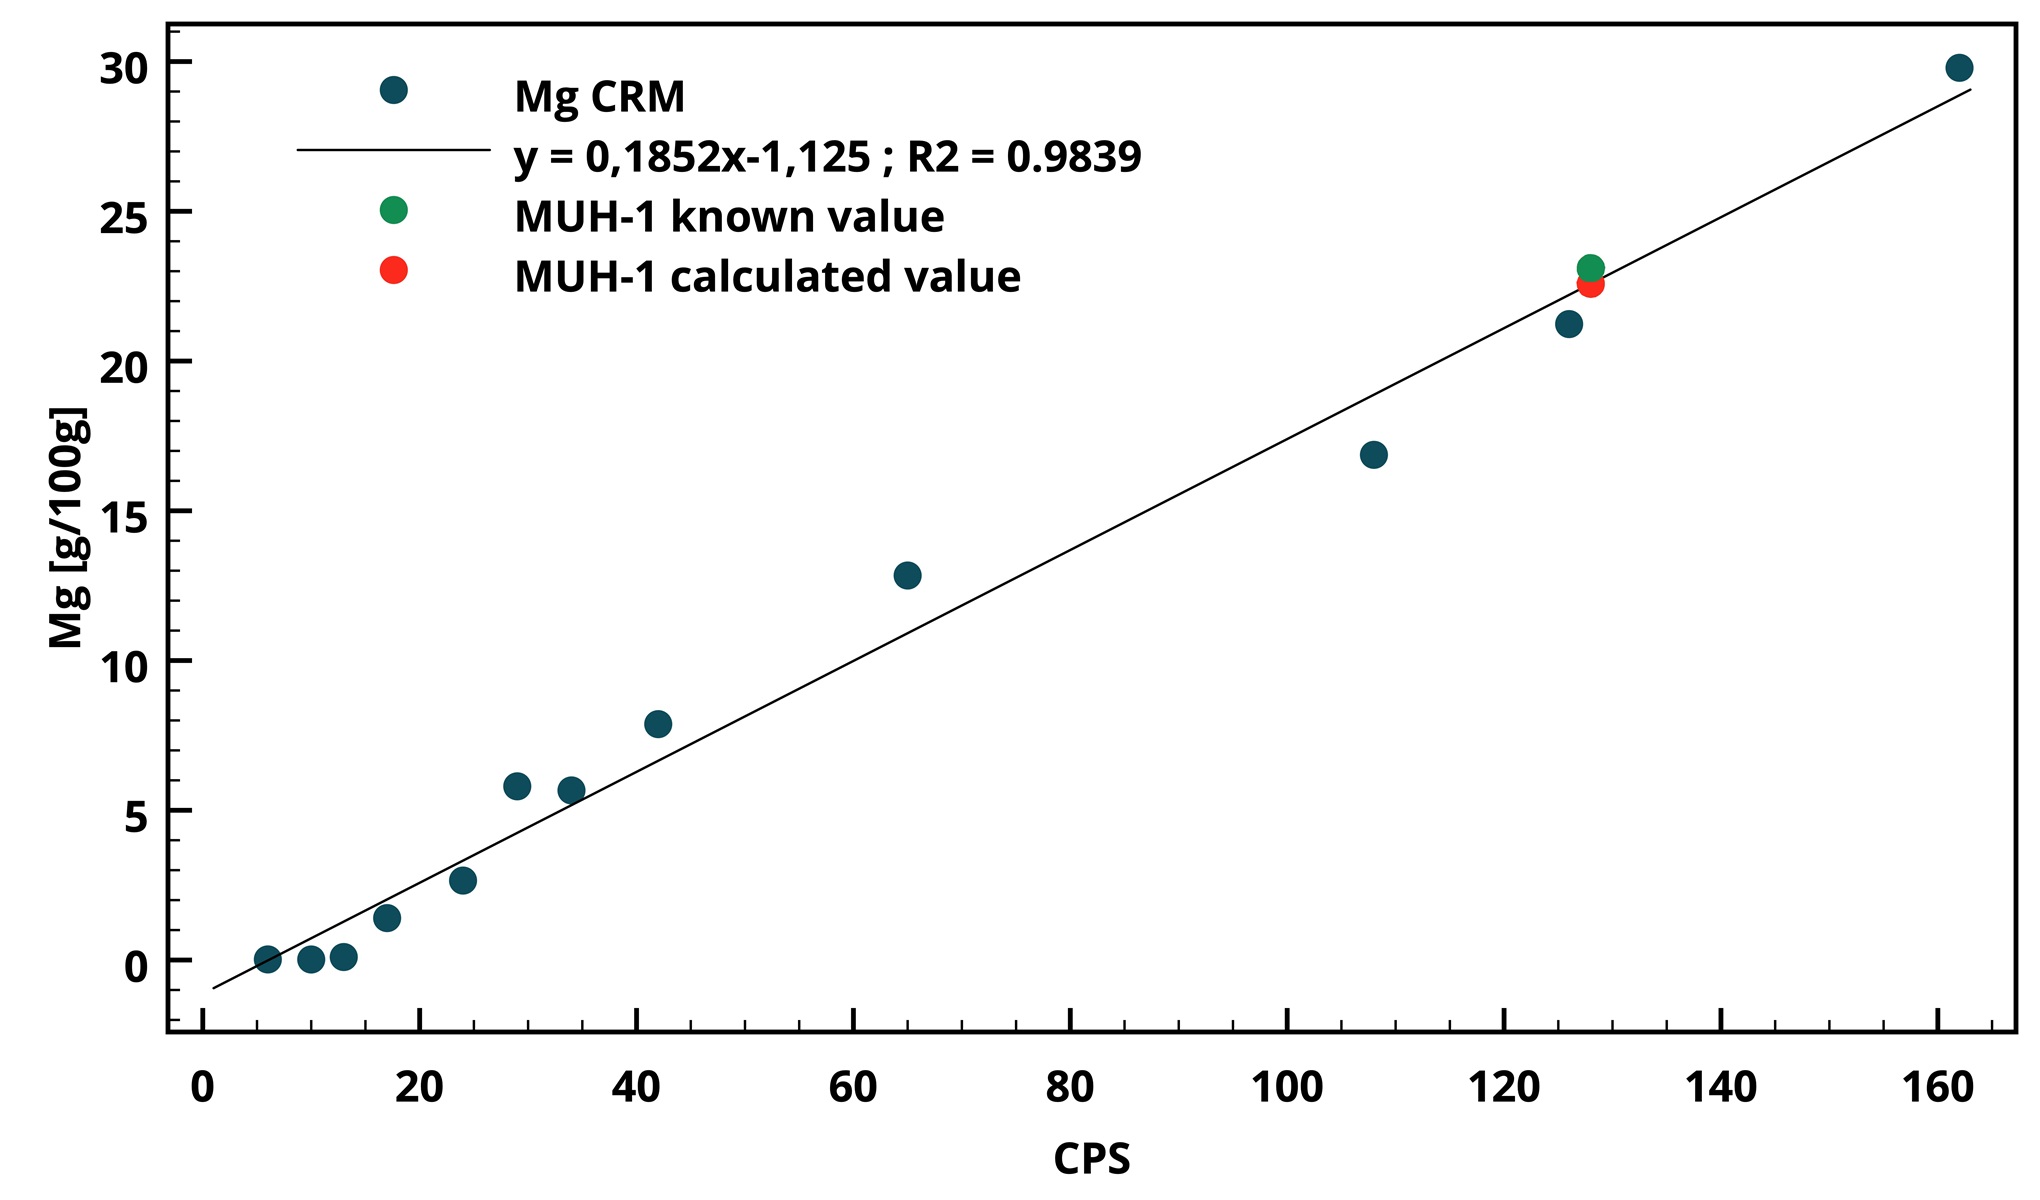
Magnesium Calibration Curve
Using 12 different lithogeochemical certified reference materials and raw instrumental spectral data a calibration curve for magnesium (Mg) was calculated and validated using a 13th material, which was not part of the calibration curve. The x-axis shows the detector signal in counts per second (CPS) and the y-axis the corresponding Mg concentration in g/100 g. Generally speaking, XRF analyses of light elements on loose powders can often be inaccurate to their impeded fluorescence yield. Pressed pellets can help to mitigate this effect, as showcased by an excellent correlation coefficient of 0.984. Further, the calculated value matches the known value of the CRM showing excellent accuracy. The known and calculated values are 23.1 and 22.6 g/100 g respectively, yielding an accuracy of 97.8 %, without considering the values’ uncertainties. Each data point is an average spectrum comprised of four measurements, after each individual measurement the sample was rotated by 90°.
The following CRM were used as pressed pellets to build the calibration curve, the exception being MUH-1, which was used to validate it: AC-E (Granite), BE-N (Basalt), BIR-1a (Basalt), CHR-Pt+ (Chromitite), DTS-2b (Dunite), DR-N (Diorite), ECRM 752-1 (Limestone), ECRM 782-1 (Dolomite), GH (Granite), OREAS 20a (Granodiorite), PM-S (Microgabbro), UB-N (Serpentinite) and MUH-1 (Harzburgite)
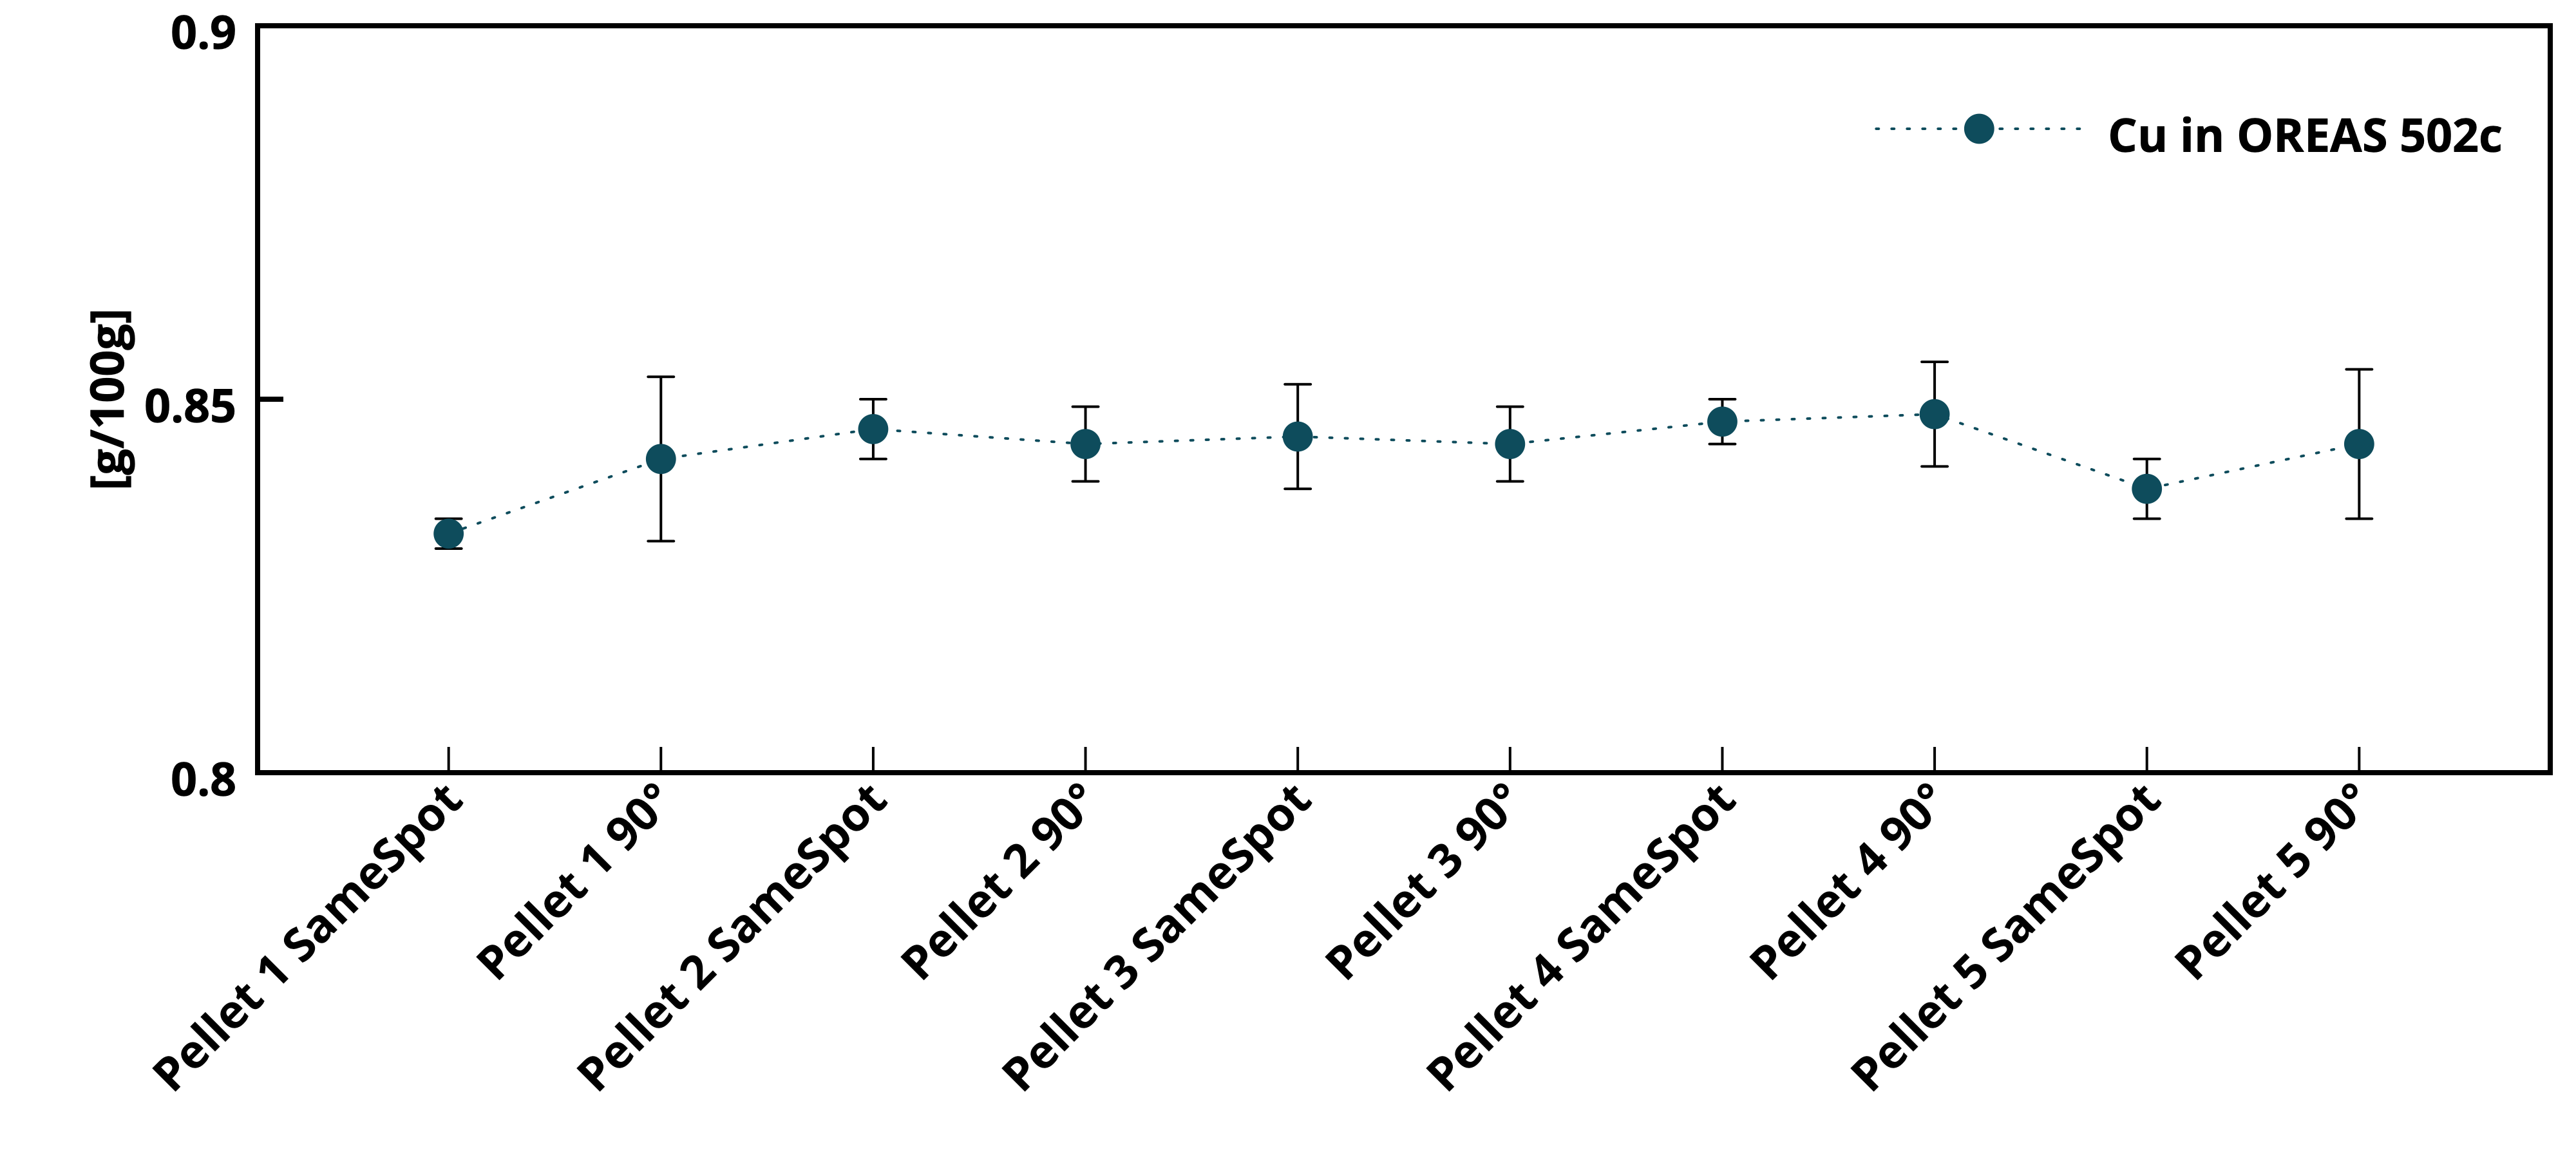
Homogeneity Test
A homogeneity test comprised of five pressed pellets made from OREAS 502c was performed. Each pellet was measured four times in the same spot and four times while rotating the sample 90° between each measurement. The results show excellent within- and between pellet homogeneity. The error bars are 2 SD of the four aforementioned measurements.The graph shows the homogeneity as an example for copper.
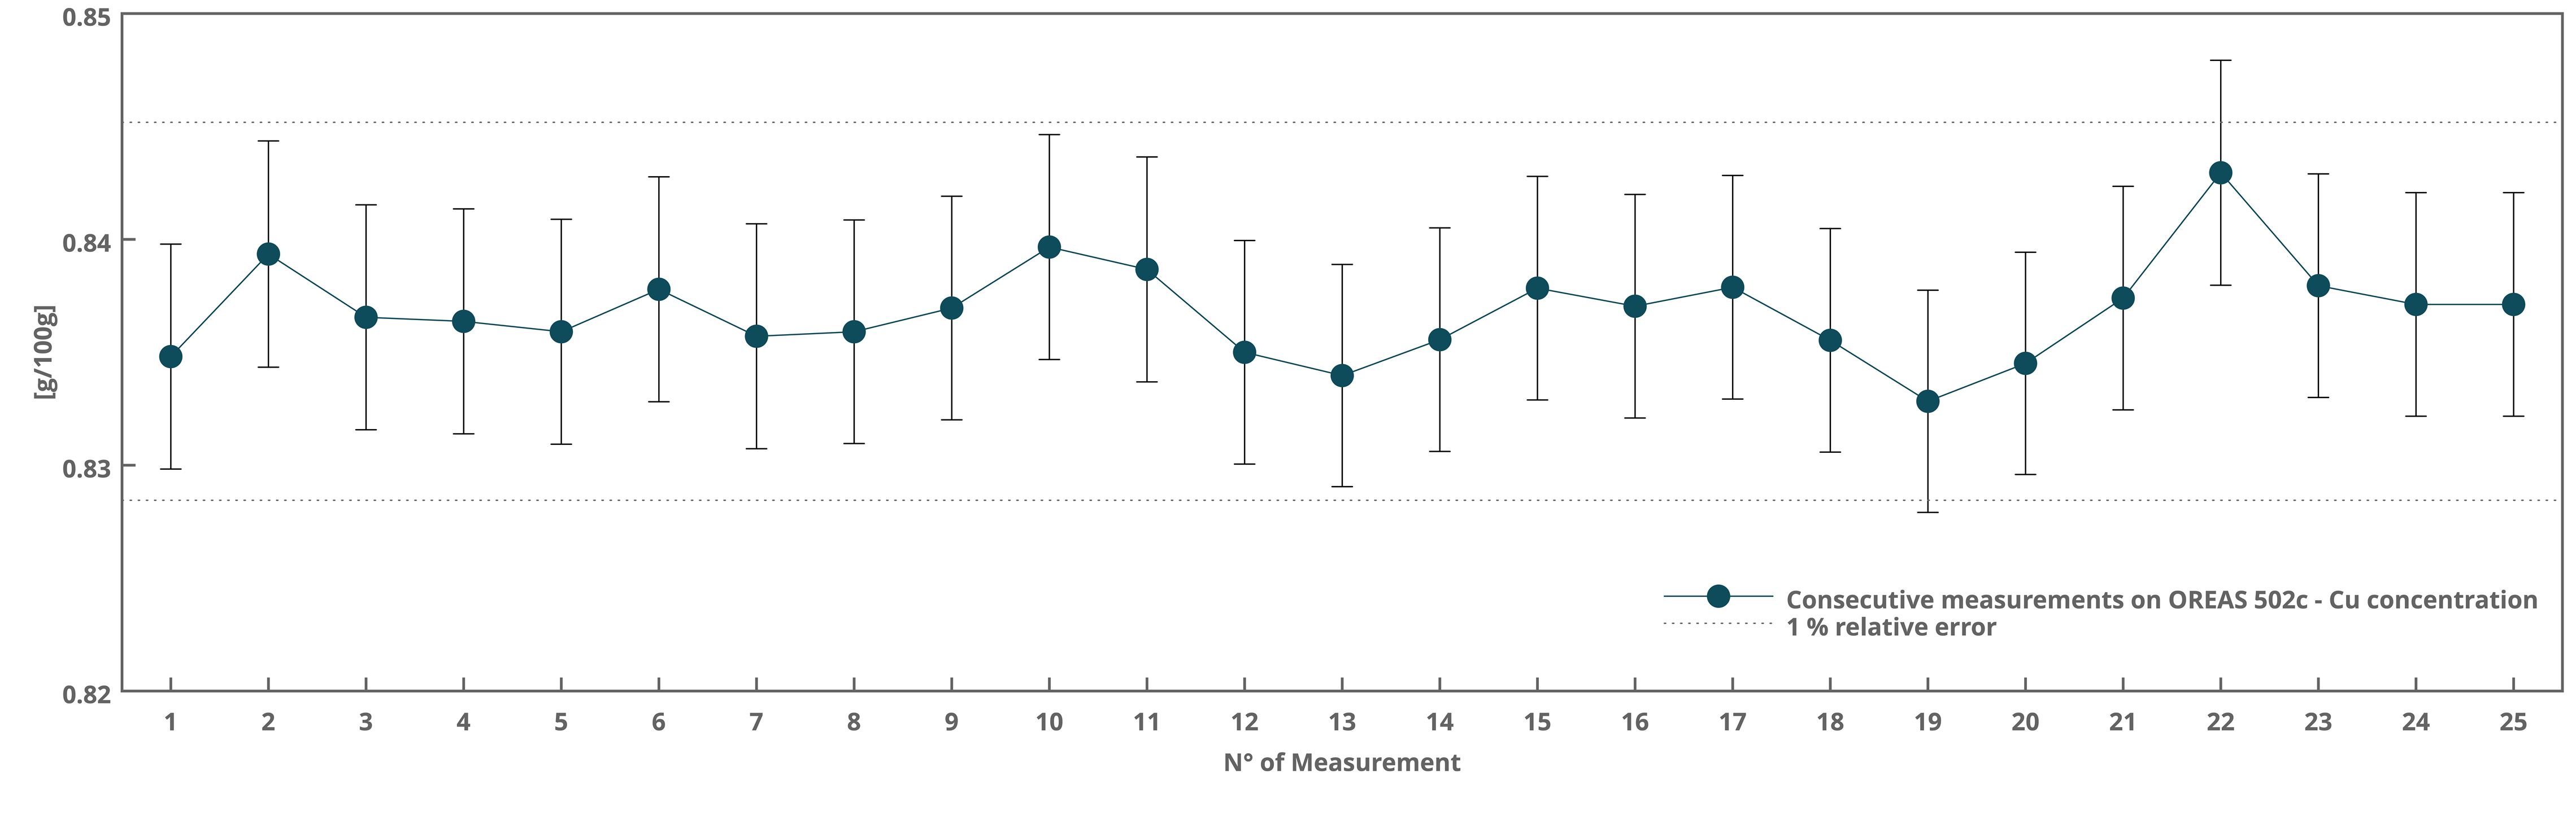
Single Pellet Long Run
This plot shows the results for Cu of 25 consecutive analyses on a single pressed pellet made from OREAS 502c. The analysis time for each data point was 4 min. and the error bars indicate the 3 SD given by the instrument. This displays excellent instrument stability, as the data points are statistically indistinguishable as well as pressed pellet stability during repeated x-ray irradiation.
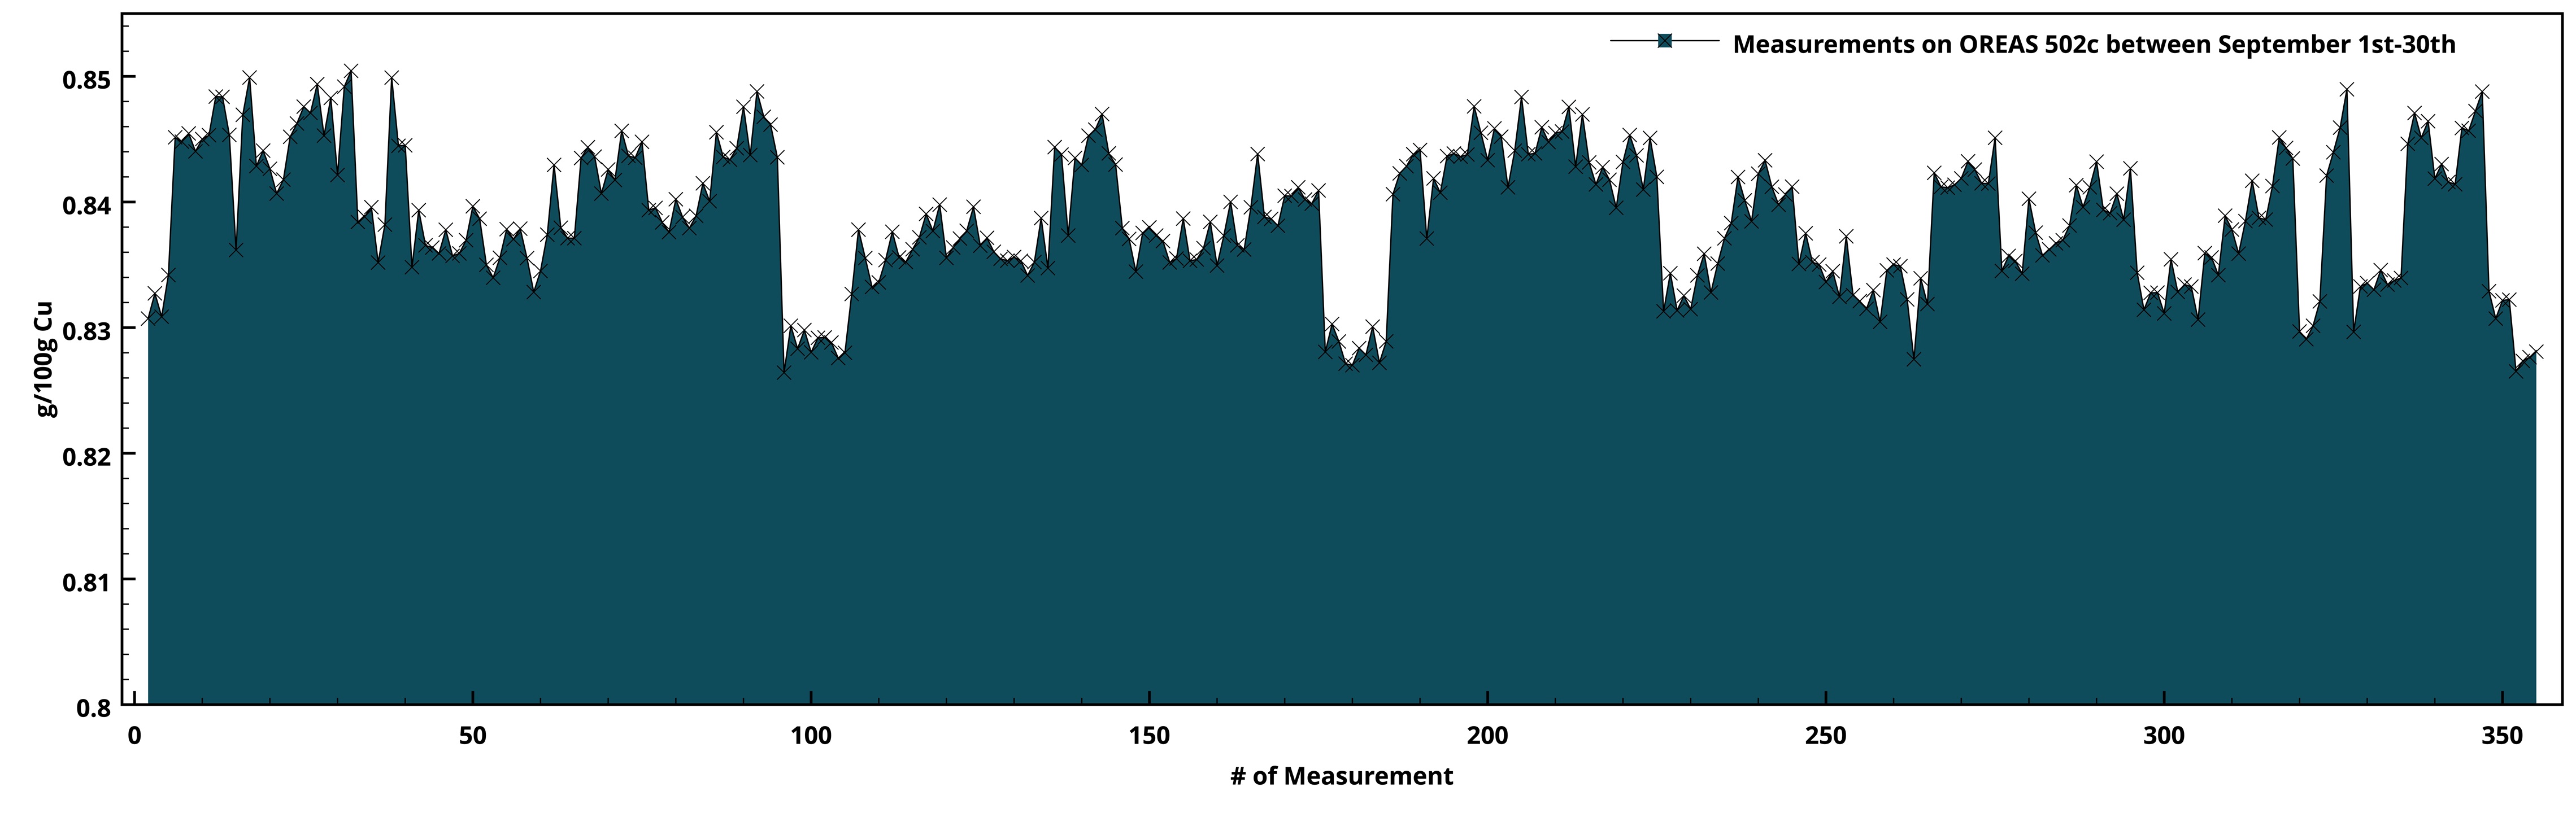
Five Pellets Long Run
This plot shows all 355 measurements performed on five different pressed pellets made from OREAS 502c between September 1st and 30th 2023. The results for copper (Cu) varied between 0.83 to 0.85 g/100 g meaning a deviation of only 0.2 g/100 g. Additionally, this highlights within and between pellet homogeneity and stability during repeated use as well as instrument stability.