
One standards - several methods
With our Nano-Pellets it is possible to use the same reference material across three different analytical techniques.
1. Laser ablation inductively coupled mass spectrometry - LA-ICP-MS
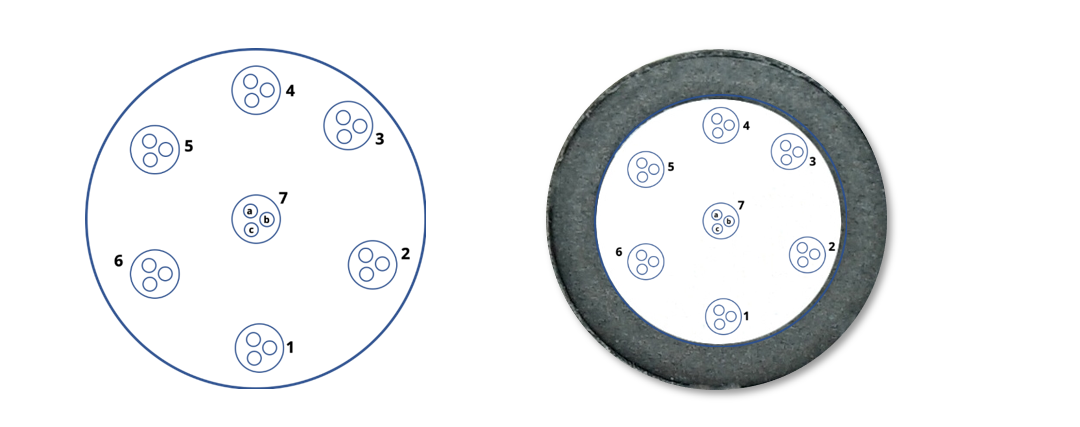
The data shown in Table 1 (Tab.1) come from a homogeneity test performed on 10 different 10 mm diameter Apatite-NP Nano-Pellets. The spot size was set to 50 µm. The analytical pattern is shown in Figure 1 (Fig.1).
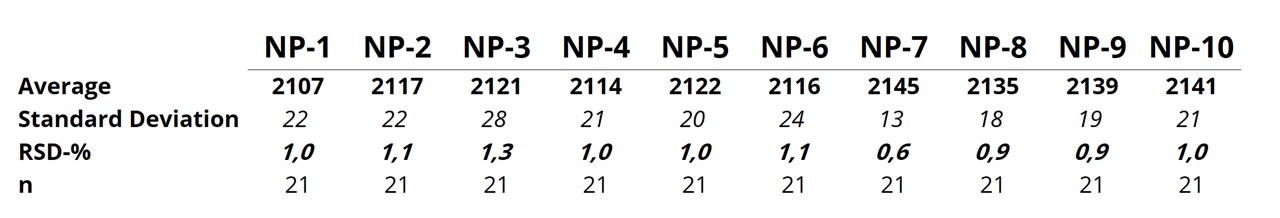
The results in Tab. 1 show each average, standard deviation, and relative standard deviation (RSD) from the 21 analyses. The data show excellent within- and between-unit homogeneity, the RSD is always around 1 %.
Data provided by Dr. Axel Sjöquist of Axray Scientific AB and Dr. Thomas Zack from the University of Gothenburg using a 213 nm NWR laser and an Agilent 8800 mass spectrometer.

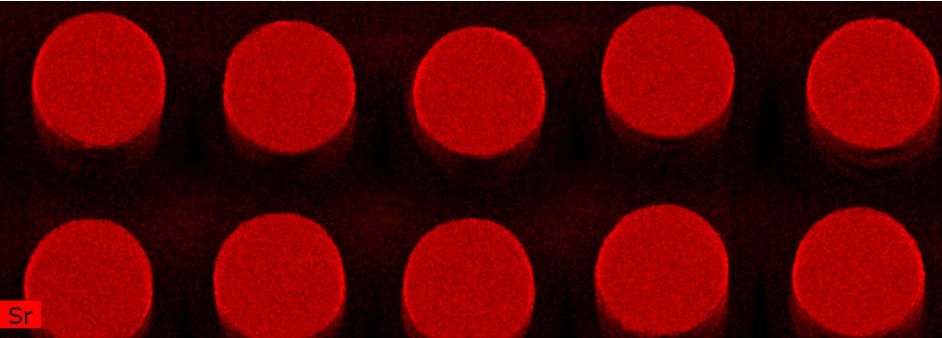
To make the Nano-Pellets infinitely thick and to avoid issues with x-ray beam geometry, 13 mm diameter NPs with a thickness of approx. 5-6 mm were used.
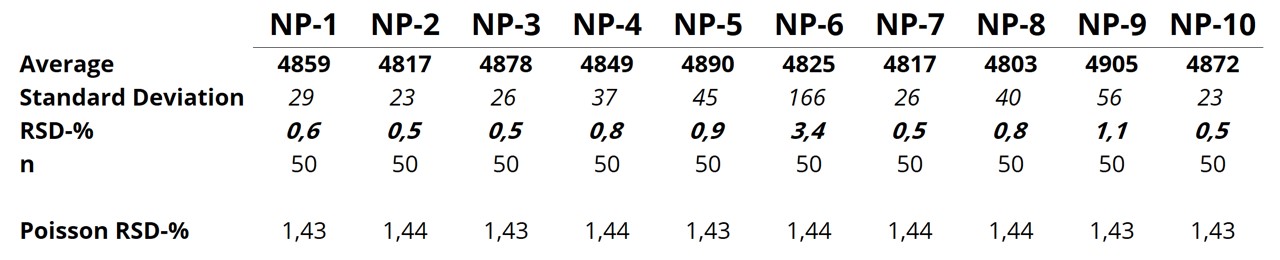
These data also show excellent within- and between-unit homogeneity. The exception is Nano-Pellet 6 where the RSD is highest at 3,4 %, most likely due to surface contamination, not instrument stability.
Since the signal from detectors in XRF instruments follows a Poisson distribution an expected standard deviation can be calculated by taking the square root of the total counts per second (cps).
Comparing the measured relative standard deviation to the Poisson relative standard deviation shows, with exception of Nano-Pellet 6, that the measured RSD is below the expected RSD from Poisson counting statistics.
Data provided by Dr. Roald Tagle, Senior Application Scientist at Bruker Nano GmbH, Berlin using the M4 Tornado instrument.
3. Laser-induced breakdown spectroscopy - LIBS
The homogeneity test using LIBS was performed on a single, 20 mm diameter Apatite-NP Nano-Pellet. The ablation pattern can be found in Fig. 4.
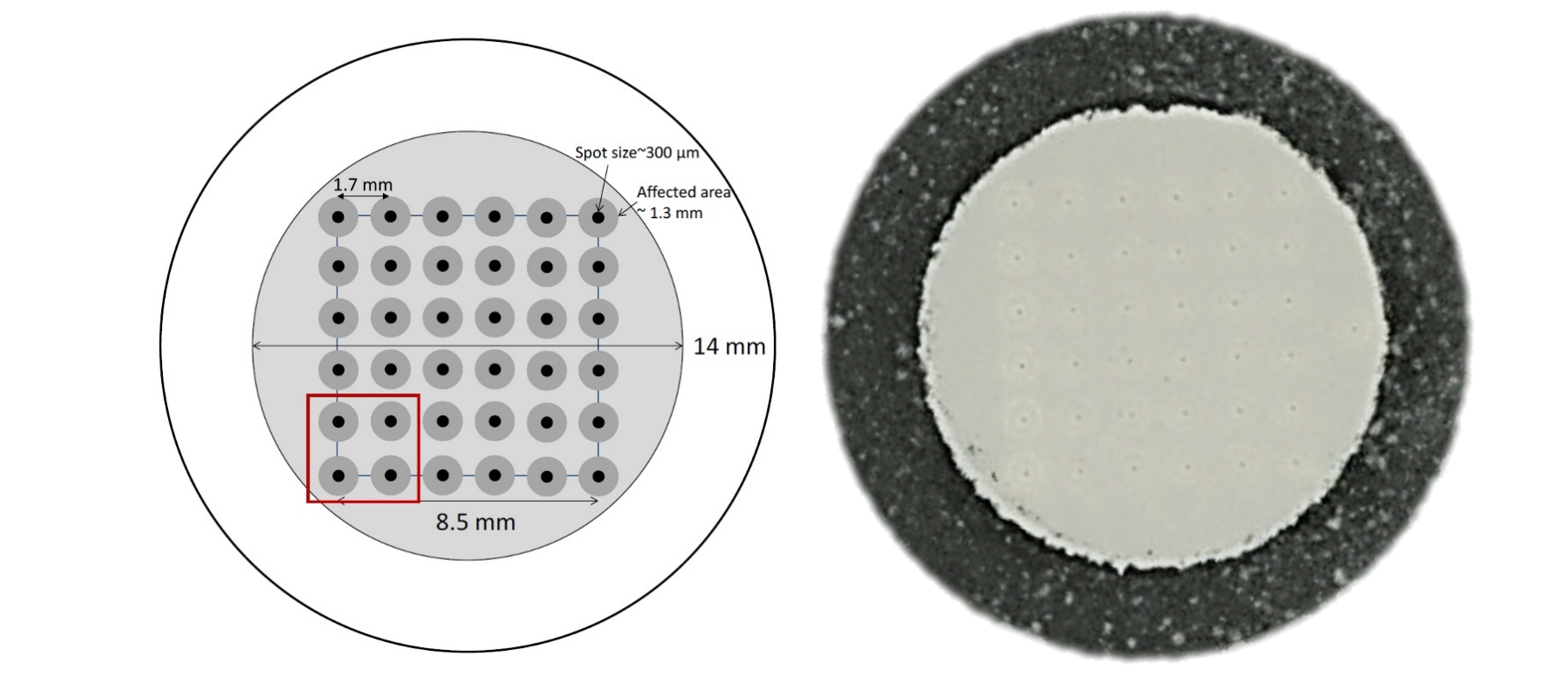
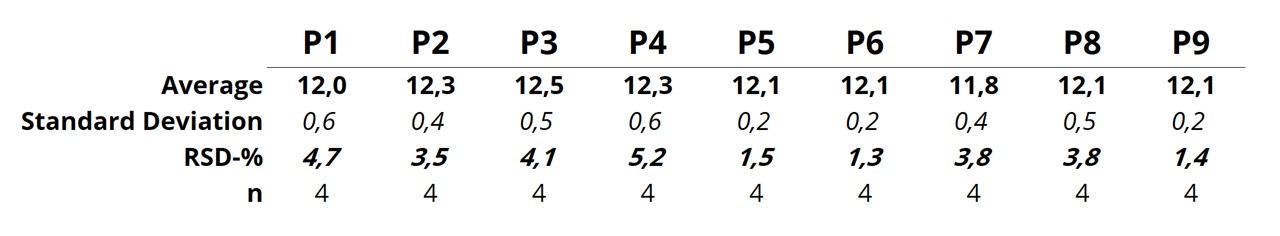
These data again show very good within-pellet homogeneity, the RSD does not exceed 6 %.
Data provided by Applied Photonics Ltd using their benchtop modular system inside an Ar-purged sample chamber coupled to Quantel Q-Smart 450 laser (1064 nm, 6 ns) and a Spectro-Module-6-Multi-channel spectrometer


